Introduction
The Plenoptic Function
Light fields use the plenoptic function to describe a scene. The plenoptic function is a 7-D function that describes light rays from all angles, at all wavelengths, at all positions in space-time:
Where is the position of the viewer in 3-D space, are the azimuthal and polar angles of the incoming light ray, respectively, is the wavelength of the light, and is time. The collection of all light rays in a scene is referred to as a light field. The plenoptic function can be reduced to four dimensions by using the two-plane parameterization:
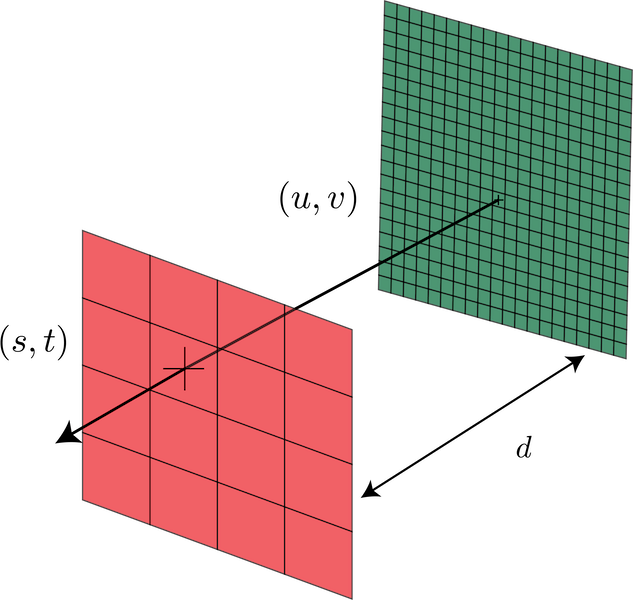
In this perspective, light rays are modeled as their point of intersection of two planes. denote the coordinates of intersection on the green plane, and are the coordinates of intersection on the red plane. The distance between the two planes, , is dependent on the camera model used to capture the light field. Most literature refers to light fields by this parameterization, .
Camera Models
The simplest way to imagine capturing a light field is with a camera array. Using the two-plane parameterization, each coordinate on the plane is a different camera aligned on a grid, and is the image captured by each camera. Then, is the focal length of the camera lenses. If each camera were to take a photo at the exact same time, then each image will be of the same scene from slightly different viewpoints. The collection of all of these images is referred to as a light field image. The individual images are referred to as sub-aperture views.
It is also possible to use a single camera to capture a light field image. In this case, a micro-lenslet array is placed between the camera’s lens and its image sensor. is the distance between the lens and the micro-lenslet array.
Epi-polar Plane Images
To extract depth from a light field image, you need to look at how a row or column of pixels changes across a row or column of sub-aperture views.
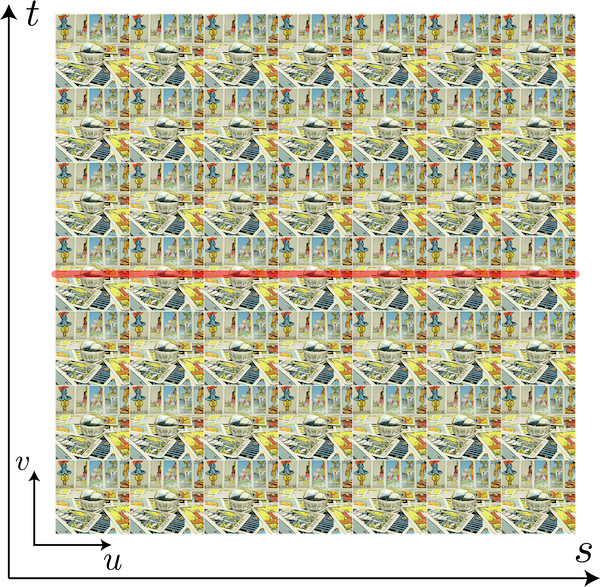
Here’s an example of a light field image. If you select the row of pixels in red across the row of sub-aperture views and stack them on top of each other, you arrive at a new 2-D image called an epi-polar plane image (EPI):

As you can see, an EPI shows the same row (column) of pixels from a row (column) of sub-aperture views. The position of the pixels are shifted slightly across each view, forming lines of different slopes. The slopes of these lines indicate the depth of the object that the pixels belong to. These lines are governed by the equations
where is the position of the object in 3-D space, and is the distance between the and planes. The intersection of and in 4-D space gives the depth of the object.
It’s also interesting to look at the frequency domain of an EPI:
Can you see the lines crossing through the origin? Each of these represents a different depth found in the EPI. These lines are governed by the equations
where are the frequency components for . The above figure only shows the 2-D frequency domain of an EPI in , denoted . The true depth of an object is again, the intersection of these two equations in 4-D frequency space. By examining the frequency domain of an EPI, we can build band-pass filters that can re-focus the light field onto an object based on its depth: